| |
|
|
| |
|
ProStat Features List
Show me in printer
friendly format: Statfeat.pdf
|
| |
|
Statistical Analysis
Contents |
| |
|
|
|
Plotting Features Contents |
| |
|
|
|
| |
| Statistical
Analysis |
- data sheet with 1,048,576 rows by 1024 columns
- WYSIWYG data sheet preview
- full data block-editing options: cut, copy,
paste, delete, clear, insert, and undo
- data format conversion: hex, oct, bin, and
decimal
- supporting numbers, ASCII text, date, time
- automatic data
generation: random (uniform, Gaussian, binomial, Poisson, and
exponential), algebraic, geometric, and user-defined functions
- text editing window for calculated results and
reports
- IEEE numerics
- handling of missing data
- data sieving (user defined step size), ranking
(ascending or descending), sorting, normalizing (five methods), differencing,
combining, splitting, summation, and frequency counting
- multiple levels sorting
- math transforms for multiple equations and
variables
- weightd average
- eight step-by-step tutorial lessons for quick
start
- built-in calculator
- user-defined hot keys
- import: ASCII, Lotus, dBase, DIF, Excel, CSV,
Access, Wave, and Quattro Pro
- export: ASCII, Lotus, dBase, DIF, and Excel
- export to ASCII with user specified precision
- drag-and-drop with automatic file type detection
Back to top
- sum of samples, sum of absolute, sum of squares,
arithmetic mean, quadraric mean, harmonic mean, absolute mean, variance,
standard deviation, absolute deviation, standard error, coefficient of variance,
skewness, coefficient of skewness, index of kurtosis, coefficient of kurtosis
- percentiles: 10th, 25th, 50th 75th and 90th
percentiles
- quartiles
- 95% confidence interval, 99% confidence interval
- t-test: one and two samples; paired and
unpaired
- multiple t-test
- F-test
- nonparametric: sign, goodness of fit, Poisson,
binomial, Wilcoxon rank sum, Wilcoxon sign rank, Friedman, Kruskal-Wallis,
Mann-Whitney, Wald-Wolfowitz, Lilliefors, chi-sq,and Kolmogorov-Smirnov
- Kaplan-Meier survival and hazard estimates
- Shapiro-Wilk normality test
- factor analysis with four rotating methods:
varimax, quartimax, equamax, and parsimax
- principal component analysis with four rotating
methods
- cluster analysis: k-means cluster and and
hierarchical cluster
- discriminant analysis
- correspondence analysis
- canonical analysis
Back to top
- frequency table
- McNemar
- Fisher
- contingency table
- record and play user-define macro for data
editing and analysis procedures
|
- user-defined functions: any combination of
predefined functions using ‘ +, -, *, /, ^ ’ operators
- transformation model up to 50 equations
- simple one-line transformation
- FFT and discrete Fourier transform
- forward and inverse transformation
- real or complex FFT and Fourier transform
- data convolution
Predefined
regressions
User-defined
regression
- user-defined: nonlinear model with up to 50
equations
- three robust fitting methods: Levenberg-Marquardt,
Powell, and simplex
- user-specified weighting factors: global or
local weighting factors
- user-specified data ranges
- comparison of two linear regression results
- parameter statistics: covariance matrix,
standard error, standard deviation, goodness-of-fit statistics, and confidence
and prediction intervals
Back to top
- one-way: with or without repeated measurements
- two-way: with or without replication
- three-way factorial
- multiple comparison: Fisher, Bonferroni,Scheffe,
Tukey, SNK, Duncan, Dunnett, and nonparametric
- ANCOVA
- one- and two-way MANOVA
Back to top
- Pearson, Spearman, Kendall, partial, multiple,
serial, canonical
- index number
- singular spectrum analysis
- autocorrelation and partial autocorrelation
- trend removal: mean, linear, power, exponential,
and polynomial
- smoothing and forecasting: simple moving
average, weighted moving average, exponential, spline
- simple and seasonal difference
- seasonal decomposition
- periodogram
- data tapering: Barlett and Von Hann
Dose-response analysis
- logit and probit models for any
probability level of LD/LC (such as
LD50/LC50, LD75/LC75, ...) with confidence intervals
- four- and three-parameter
sigmoidal models for EC50/IC50/DC50/GI50
Back to top
|
- Pareto analysis
- quality control for measurements and attributes
with user-controllable sigma count
- QC chart for measurements without subgroup: X
Chart (R), X Chart (s), Moving Range, and Moving Average
- QC chart for measurements with subgroup:
R-Chart, S-Chart, X Bar Chart, and S-sq Chart
- QCchart for attributes: P-Chart, NP-Chart, C
Chart, U-Sq Chart
- process capability analysis: Cpk, Cp, Cm, Cr, Zu,
Zl, and Zmin
- critical value to (or from) tail probability
conversion for commonly used distributions: normal, Student-t, F, chi-sq,
exponential, Poisson, and binomial
- fitting sample data to 10 predefined
distributions
- automatic creation of density-function data
- ABS(x): Absolute value
- ACLOGLOG(x): Inversion of complementary log-log
function: 1-exp(-exp(x))
- ACOS(x): Inverse of trigonometric cosine
- ACOSH(x): Inverse of hyperbolic cosine
- ALOGIT(x): Inverse of logit
- ALOGIT100(x): Inverse of logit100
- ASIN(x): Inverse of trigonometric sine
- ASINH(x): Inverse of hyperbolic sine
- ATAN(x): Inverse of trigonometric tangent
- ATAN2(x,y): Arc tangent of y/x
- ATANH(x): Inverse of hyperbolic tangent
- BETA(x,y): Beta function
- BESSELJ(n,x): Bessel function J with integer
order n
- BESSELY(n,x): Bessel function Y with integer n
- BESSELI(n,x): Modified Bessel function I with
integer order n
- BESSELK(n,x): Modified Bessel function K with
integer order n
- BINOMIAL(n,m): Binomila coefficient of
(n,m)
- CEIL(x): Smallest integer not less than x
- CLOGLOG(x): complementary log-log function:
log(-log(1-x))
- COS(x): Trigonometric cosine
- COSH(x): Hyperbolic cosine
- DAWSON(x): Dawson integral
- DEGREE(x): Convert radians to degrees
- EXP(x): Natural exponential
- ERR(x): Error function
- ERRC(x): Complementary error function
1-ERR
- EXP(x): Natural exponential
- EXPINT(x): Exponential integral
- FACTORIAL(x): Factorial function
- FLOOR(x): Largest integer not greater than
x
- GAMMA(x): Gamma function
- GAMMAP(x,y): Imcomplete gamma
function
- GAMMAQ(x,y): 1-GAMMAP(x,y)
- GAUSSIAN(x): Gauss Distribution
- LN(x): Natural logarithmic
- LOG(x): Natural logarithmic
- LOG10(x): Common (Base 10) logarithmic
- LOGFACORIAL(n): log-facttorial: log(n!)
- LOGIT(x): Unit based logit
- LOGIT100(x): 100 based logit
- MAX(x,y): Larger value of x and y
- MIN(x,y): Smaller value of x and y
- MOD(x,y): Remainder f of x/y if x=a*y+f
- NORMDEV(x): Derivative of integrated
normal distribution
- NORMINT(x): Integration of normal
distribution
- POW10(x): Base 10 exponential
- POW10(x): Base 10 exponential
- POWER(x,y): x to the power of y
- PROBIT(x): Probit(x)=NormDev(x)+5
- RADIAN(x): Convert degrees to radians
- RANDOM(x): Random number between 0
and x-1
- ROUND(x): Convert real to the nearest
integer
- SIGN(x): Sign of a number (1,0,-1)
- SIN(x): Trigonometric sine
- SINH(x): Hyperbolic sine
- SQR(x): Square function
- SQRT(x): Square root function
- TAN(x): Trigonometric tangent
- TANH(x): Hyperbolic tangent
- TRUNC(x): Convert real to an integer
toward zero
- UNIT(x): If x>=0 then 1 else 0
Back to top
|
|
|
2D and 3D Plots |
- full-page WYSIWYG graphics editing mode with
changeable mouse cursor
- Full OLE 2.0 implementation: client/server
- dynamic link of plot and data sheet
- embedding plots in Word and PowerPoint
- interactive curve fitting
- calculate area under a curve
- editable configuration for plotting objects
- optional on-screen rulers in either metric or
English units
- optional page guidelines and grid lines
- editing tools: copy, cut, paste, undo; group,
ungroup; zoom, and unzoom
- drawing toolbox: commonly used shapes, and text
| 46 drawing tools allow you draw
different shapes at any size and at any location on your plot |
 |
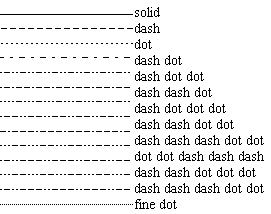
| line size from 1
to 100 with an
unit of 1/288
inches |
 |
- data inspection: verification of data point
- moving, resizing, and rotation in 2D and 3D
- multiple graphs in one page
- user-designed background patterns for slide
presentations

- saving plot attributes as a template for routine
work
- batch plotting
- conversion from color to gray scale
- global change of line size and symbol size
Back to top
- exportation to most popular graphics formats:
EPS, Postscript, WMF, EMF, PDF, GIF, BMP, JPG, TIFF, and PNG
- real-time display of dynamical data
Back to top
|
2D Plot
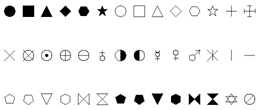
| 42 accurate symbols
with user-controllable
size (with increment of
1/288 inches in
diameter) |
 |
- 2D pie chart
- 2D bar:
horizontal/vertical bar charts with error
bars,
grouped bars, vertical/horizontal
stack bars
- 2D special: open/closed
area, vector,
step and survival curve,
box and
high-low,
histogram,
stock, column,
floating columns, and auto-
error bars
- three commonly used
box and whisker plot types:
skeleton boxplot,
fenced boxplot, and
percentile boxplot
- quality control chart
for measurements without subgroup: X Chart (R), X Chart (s), Moving Range, and
Moving Average
- quality control chart
for measurements with subgroup: R-Chart, S-Chart, X Bar Chart, and S-sq Chart
- quality control chart
for attributes: P-Chart, NP-Chart, C Chart, U-Sq Chart
- Tableau plots (animal zoo plots) for scattering
curves, vertical bars, and horizontal bars
3D Plot
Function Plot
- function plot: 2D curves, 3D curves, and 3D
surfaces
Back to top
- text tool for annotation:
text sizing and rotation
- creation of equations
including symbols, superscripts, and subscripts
- alignment of text and graphics objects
- easy-to-use
legend editor with 35
user-controllable entries
- WYSIWYG preview
- template plot for repeated job
- create multiple graphs instantly with
batch process
Back to top
|
-
linear,
reciprocal, log decimal, log
exponential, log(log), ln, dB, logit, 10 base, probability, probit, percent,
currency, day, month, date, date-time, and text. See
special graphics scaled papers, click here
Axis mode:
linear scale

Back to top
Axis mode: nonlinear scale

Back to top
Axis
attributes

|
|
|
Documentation
|
- printed users' handbook over 380 pages
- superior tutorial lessons with step-by-step
instruction
- online help system
Back to top |
|
|
|
|
|
|
|
|
|