| |
|
|
|
|
|
Data Analysis Features Contents |
| |
|
|
|
Plotting Features Contents |
| |
|
|
- data sheet with 1,048,576 rows by 1024
columns
- WYSIWYG data sheet preview
- full data block-editing options: cut, copy,
paste, delete, clear, insert, and undo
- supporting numbers: ASCII text, date,
time, and date-time
- data format conversion: hex, oct, bin, and
decimal
- automatic data generation: random,
algebraic, geometric, and user-defined
functions
- text editing window for calculated results
and reports
- IEEE numerics standard
- handling of missing data
- data sieving (select data according to user defined step size)
- data ranking (ascending or descending)
- data sorting
(multiple levels)
- data trimming
- normalizing
(normal distribution, uni-length, percentage,
accumulated percent, ternary, and user scale)
- differencing, combining, merging, splitting, summation, and
frequency counting
- built-in calculator
- user-defined hot keys
Back to top
- import: keyboard, ASCII, Access, Lotus, dBase,
DIF, Excel, CSV, Quattro Pro, and Wave
- export: ASCII , Lotus, dBase, DIF, and
Excel
- drag-and-drop automatical file type
detection
- user-defined functions: any combination of
predefined functions using ‘ +, -, *, /, ^ ’
operators
- transformation model up to 50 equations
- simple one-line transformation
Back to top
- basic manipulation: determinant, trace,
addition, subtraction, matrix products,
vector products
- matrix inversion and transposition
- calculation of eigen values and eigen
vectors
- scalar transformation of matrix or vector
- three matrix decomposition methods: LU, QR, and
SVD
- linear equation solver
- data smoothing: Lanczos, moving window,
Savitzky-Golay, Gram, and averaging
- digital data filtering (infinite impulse
response and Butterworth): notch,
band-pass, low-pass, and high-pass
- FFT and power spectrum: real or complex
numbers
- wavelet transformation
- data windowing: square, Bartlett, Hanning,
Hamming, Blackman, Welch, and Parzen
windows
- singular spectrum analysis
- numerical differentiation
- numerical integration of user-defined
function or numerical data
|
- polynomial interpolation
- rational interpolation
- cubic spline (natural and clamped)
interpolation
- Stineman interpolation
Predefined fitting
Linear
fitting
- least square fitting
- robust linear fitting
- Deming linear fitting
- Passing-Bablok linear fitting
Dose-response analysis
- logit and probit models for any
probability level of LD/LC (such as
LD50/LC50, LD75/LC75, ...) with confidence intervals
- four- and three-parameter
sigmoidal models for EC50/IC50/DC50/GI50
User-defined fitting
- three robust fitting methods: Levenberg-Marquardt,
Powell, and simplex
- user-defined model up to 50 equations
- user-defined fitting: nonlinear model with
up to 50 variables and 50 equations
- model template
- user-specified weighting factors
- constraints on the parameters
- parameter statistics: covariance matrix,
standard error, standard deviation,
goodness-of-fit statistics, and confidence
and prediction intervals
Back to top
- six different numerical methods: bisection,
Newton-Raphson, false position, secant,
Ridders, and VWDB
- user-specified variable ranges
- searching for multiple roots
- equations up to 3 dimensions
- user specified iteration number
- pre-iteration option
- nine different numerical methods (Euler,
Runge-Kutta, 2nd order Runge-Kutta,
Adaptive Runge-Kutta, modified midpoint,
Bulirsch-Stoer, Cash-Carp,
Kaps-Rentrop, Bader-Deuflhard) for stiff
and nonstiff problems
- user-specified error control
- model up to 50 equations
- built-in model template
Back to top
|
- descriptive statistics
- t-test, multiple t-test, F-test
- one- and two-way ANOVA
- Kaplan-Meier survival and hazard estimates
- nonparametric test: chi-sq and sign tests
- record and play user-define macro for data
editing and analysis procedures
- ABS(x): Absolute value
- ACLOGLOG(x): Inversion of complementary log-log
function: 1-exp(-exp(x))
- ACOS(x): Inverse of trigonometric cosine
- ACOSH(x): Inverse of hyperbolic cosine
- ALOGIT(x): Inverse of logit
- ALOGIT100(x): Inverse of logit100
- ASIN(x): Inverse of trigonometric sine
- ASINH(x): Inverse of hyperbolic sine
- ATAN(x): Inverse of trigonometric tangent
- ATAN2(x,y): Arc tangent of y/x
- ATANH(x): Inverse of hyperbolic tangent
- BETA(x,y): Beta function
- BESSELJ(n,x): Bessel function J with integer
order n
- BESSELY(n,x): Bessel function Y with integer n
- BESSELI(n,x): Modified Bessel function I with
integer order n
- BESSELK(n,x): Modified Bessel function K with
integer order n
- BINOMIAL(n,m): Binomila coefficient of
(n,m)
- CEIL(x): Smallest integer not less than x
- CLOGLOG(x): complementary log-log function:
log(-log(1-x))
- COS(x): Trigonometric cosine
- COSH(x): Hyperbolic cosine
- DAWSON(x): Dawson integral
- DEGREE(x): Convert radians to degrees
- EXP(x): Natural exponential
- ERR(x): Error function
- ERRC(x): Complementary error function
1-ERR
- EXP(x): Natural exponential
- EXPINT(x): Exponential integral
- FACTORIAL(x): Factorial function
- FLOOR(x): Largest integer not greater than
x
- GAMMA(x): Gamma function
- GAMMAP(x,y): Imcomplete gamma
function
- GAMMAQ(x,y): 1-GAMMAP(x,y)
- GAUSSIAN(x): Gauss Distribution
- LN(x): Natural logarithmic
- LOG(x): Natural logarithmic
- LOG10(x): Common (Base 10) logarithmic
- LOGFACORIAL(n): log-facttorial: log(n!)
- LOGIT(x): Unit based logit
- LOGIT100(x): 100 based logit
- MAX(x,y): Larger value of x and y
- MIN(x,y): Smaller value of x and y
- MOD(x,y): Remainder f of x/y if x=a*y+f
- NORMDEV(x): Derivative of integrated
normal distribution
- NORMINT(x): Integration of normal
distribution
- POW10(x): Base 10 exponential
- POW10(x): Base 10 exponential
- POWER(x,y): x to the power of y
- PROBIT(x): Probit(x)=NormDev(x)+5
- RADIAN(x): Convert degrees to radians
- RANDOM(x): Random number between 0
and x-1
- ROUND(x): Convert real to the nearest
integer
- SIGN(x): Sign of a number (1,0,-1)
- SIN(x): Trigonometric sine
- SINH(x): Hyperbolic sine
- SQR(x): Square function
- SQRT(x): Square root function
- TAN(x): Trigonometric tangent
- TANH(x): Hyperbolic tangent
- TRUNC(x): Convert real to an integer
toward zero
- UNIT(x): If x>=0 then 1 else 0
|
- full-page WYSIWYG graphics editing
mode
- Full OLE 2.0 implementation: client/server
- dynamic link of plot and data sheet
- editable configuration for plotting objects
- embedding plots in Word and PowerPoint
- interactive curve fitting
- calculate area under a curve
- optional on-screen rulers in either metric or
English units
- optional page guidelines
- optional grid lines
-
changeable mouse cursor
- editing tools: copy, cut, paste,
- multiple-level undo
- group,
ungroup
- zoom, and unzoom
- axes zoom
- drawing toolbox: commonly used shapes,
and text
| 46 drawing tools allow you draw
different shapes at any size and at any location on your plot |
 |
| line size from 1
to 100 with an
unit of 1/288
inches |
 |
- data inspection: verification of data point
- moving, resizing, and rotation in 2D and
3D
- multiple graphs in one page
- add multiple fitted curves graphically
- user-designed background patterns for
slide presentations

- saving plot attributes as a template for
routine work
- template and batch plotting
- conversion from color to gray scale
- global change of line size and symbol size
Back to top
- exportation to most popular graphics
formats: EPS, Postscript, PDF, WMF, EMF, GIF, BMP, JPG, TIFF, and PNG
Back to top
- template plot for repeated job
- create multiple graphs instantly with
batch process
- real-time display of dynamical data
|
2D Plot
- 2D curve: scatter, line, drop-line,
and vertical/horizontal error bars
- polar scatter plots,
error bar chart, bar
charts, bar chart with error bars, and polar stack bar charts
- user-defined plot:
different color,
symbol
style, symbol size, and
text label for each
data point
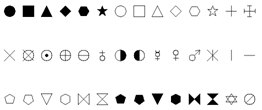
| 42 accurate symbols
with user-controllable
size (with increment of
1/288 inches in
diameter) |
 |
- 2D pie chart
- 2D bar: horizontal/vertical bar charts with
error bars,
grouped bars (clustered bars),
vertical/horizontal stack bars
- 2D special: open/closed
area, vector,
step and survival curve,
ternary (triangle) plot,
Smith chart,
Nichols chart, box-plot and
high-low,
histogram, auto-
error bars, stock charts,
floating columns, and column plots
- three commonly used
box and whisker plot
types: skeleton boxplot,
fenced boxplot,
and percentile boxplot
- quality control chart for measurements
without subgroup: X Chart (R), X Chart
(s), Moving Range, and Moving Average
- quality control chart for measurements with
subgroup: R-Chart, S-Chart, X Bar Chart,
and S-sq Chart
- quality control chart for attributes: P-Chart,
NP-Chart, C Chart, U-Sq Chart
- Tableau plots (animal zoo plots) for scattering
curves, vertical bars, and horizontal bars
3D Plot
-
3D plot: linear and log scales
- 3D curve: scatter, line, vector, drop line,
and projection
- 3D bar: vertical bar
charts, bar chart with error bars, stack bar charts, and 3D histograms
- 3D surface: Cartesian, spherical, and
cylindrical
- contour plot: line or filled contour,
automatic label contour levels
- multiple surfaces and
curves
Function Plot
- function plot: 2D curves, 3D curves, and
3D surfaces
Back to top
- text tool for annotation: text sizing and
rotation
- creation of equations including symbols,
superscripts, and subscripts
- alignment of text and graphics objects
- easy-to-use
legend editor with 35
user-controllable entries
- WYSIWYG preview
Back to top
|
-
linear,
reciprocal, log decimal, log
exponential, log(log), ln, dB, logit, 10 base,
probability, probit, percent, currency, day,
month, date, date-time, and text. See special graphics
scaled papers, click here
Axis mode: linear scale

Back to top
Axis mode: nonlinear scale

Back to top
Axis attributes

|
|
Documentation |
- printed User Guide over 300 pages
- complete menu command reference
- superior tutorial lessons with step-by-step instruction
- online help system
|
|
|
|
|
|
|