- Visual Basic
- Visual C++
- C#
- J#
- or any programming languages which support COM
model
- full-page WYSIWYG graphics editing
mode
- optional on-screen rulers in either metric or
English units
- optional page guidelines
-
changeable mouse cursor
- editing tools: copy, cut, paste, undo; group,
ungroup; zoom, and unzoom
- drawing toolbox: commonly used shapes,
and text
- customized hot keys
| 28 accurate symbols
with user-controllable
size (with increment of
1/288 inches in
diameter)
Back to top
|
 |
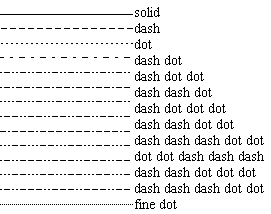
| line size from 1
to 100 with an
unit of 1/288
inches |
 |
- data inspection: verification of data point
- moving, resizing, and rotation in 2D and
3D
- multiple graphs in one page
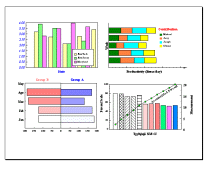
- user-designed background patterns for
slide presentations
- conversion from color to gray scale
- global change of line size and symbol size
Back to top
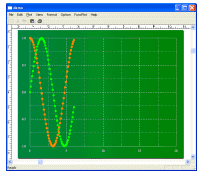
- real-time data display for multiple channels of
data
- exportation to most popular graphics
formats: EPS, Postscript, WMF, EMF, GIF, BMP, JPG, TIFF, and PNG
Back to top
- text tool for annotation: text sizing and
rotation
- creation of equations including symbols,
superscripts, and subscripts
- alignment of text and graphics objects
|
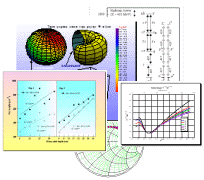
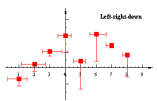
- auto- error bars
- user-defined symbol plot:
different color,
symbol
style, symbol size, and
text label for each
data point
- 2D pie chart
- 2D bar chart: horizontal
and vertical
- stacked bar
chart
- grouped bar
chart,
- bar charts with
error bars
- quality control chart: X Chart (R), X Chart
(s), Moving Range, and Moving Average, R-Chart, S-Chart, X Bar Chart,
and S-sq Chart, P-Chart,
NP-Chart, C Chart, U-Sq Chart
- 3D plot: linear and log scales
- 3D curve: scatter, line, vector, drop line,
and projection
- 3D error
bar
- 3D bar: vertical and 3D histograms
- 3D surface: Cartesian, spherical, and
cylindrical
- contour plot: line or filled contour,
automatic label contour levels
- multiple surfaces and curves
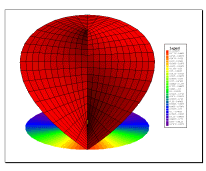
- function plot: 2D curves, 3D curves, and
3D surfaces
Back to top
- automatic or user-defined
error-bar values
- simultaneous vertical and horizontal
error
bars
- mean, standard deviation, standard error,
median, quartile, and percentiles
- easy-to-use
legend editor with 35
user-controllable entries
- WYSIWYG preview
Back to top
|
-
linear,
reciprocal, log decimal, log
exponential, log(log), ln, logit, 10 base,
probability, probit, percent, currency, day,
month, date, date-time, and text
Axis mode: linear scale

Back to top
Axis mode: nonlinear scale

Back to top
Axis attributes

|